Week 5: Comprehensive Observability — The ObserveStack Control Plane

What We’re Building Today
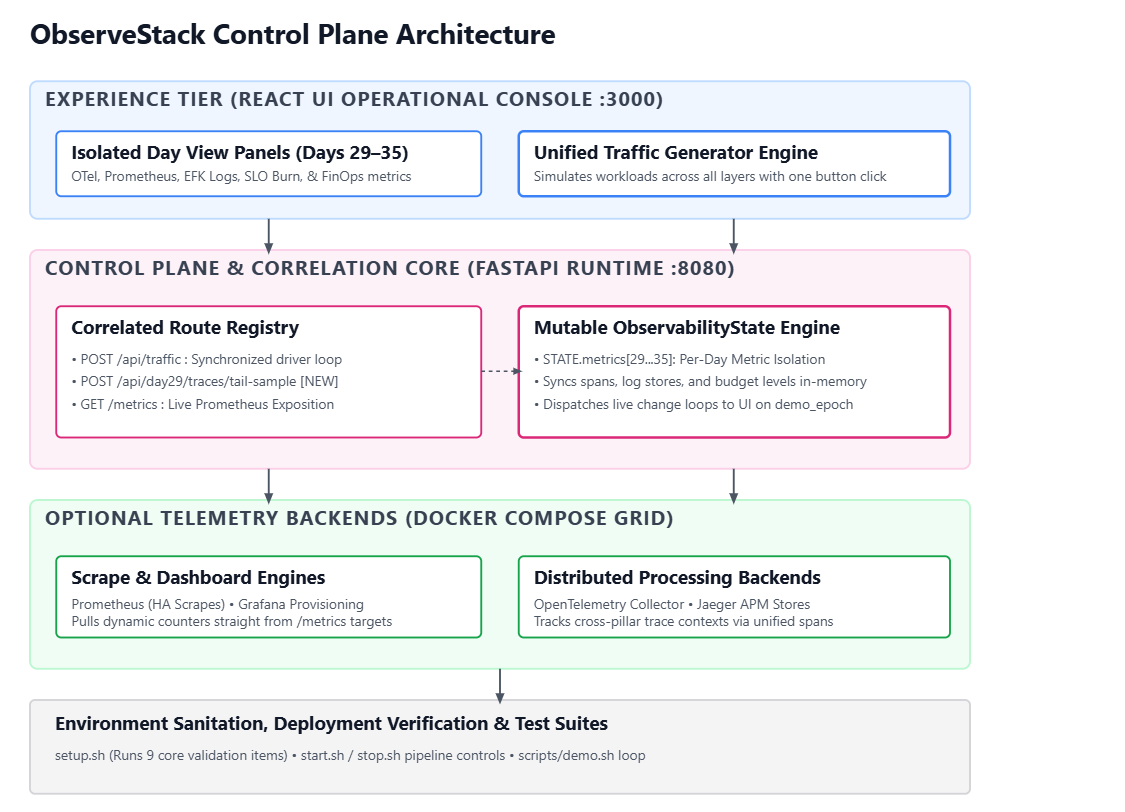
Today you’ll deploy ObserveStack: a complete observability control plane that unifies seven production practices—OpenTelemetry export, Prometheus metrics, Grafana dashboards, centralized logs, distributed tracing, SLO/error-budget management, and telemetry cost optimization—into one API and one dashboard. We build per-day metric isolation so a Grafana demo never overwrites your SLO cards, wire real Prometheus counters at
/metrics, and drive everything from a traffic generator that mimics how Netflix correlates spans, logs, and burn rates during an incident.By the end, you’ll click Generate Traffic in the UI, watch error budget drop on Day 34, optimize monthly telemetry cost on Day 35, and scrape live
commerce_orders_totalseries from Prometheus—without running seven separate lab stacks.
High-Level Agenda
Stand up the integrated FastAPI control plane and ObserveStack UI
Model Day 29 OpenTelemetry: spans, collector health, multi-signal export rates
Model Day 30 Prometheus: HA scrape posture, alerts, federation, Thanos latency
Model Day 31 Grafana: GitOps dashboard provisioning and panel throughput
Model Day 32 EFK-style logging: structured ingest, retention tiers, error log counts
Model Day 33 tracing/APM: sampling, bottleneck detection, P99 latency
Model Day 34 SLI/SLO: error budget, multi-window burn, policy evaluation
Model Day 35 FinOps: sampling, cardinality reduction, ROI on observability spend
Connect the correlation loop: traffic → spans → logs → metrics → SLO → cost
Core Concepts: Observability as a Control Plane
What Is a Unified Observability Stack?
Most teams install Prometheus, then Grafana, then a log stack, then Jaeger—each with its own UI, owners, and on-call runbooks. The hard part isn’t installing tools; it’s correlation. When payment-service P99 spikes, you need the same
trace_idin logs, the same labels on metrics, and the same time window on SLO burn charts.ObserveStack treats observability like Week 4 treated GitOps: one control plane, seven day-modules (29–35), one shared state object (
ObservabilityState), and isolated KPI namespaces (STATE.metrics[29]…STATE.metrics[35]). Each sidebar day is a lens; traffic and demos update the right lens only.Why this matters: Stripe pages on error-budget burn, not CPU graphs. Shopify cuts log retention before finance reviews the bill. Your platform team needs one surface where “generate load” and “evaluate SLO” are one click apart—how production war rooms actually run.
The Three Pillars (and Why One ID Rules Them All)
Metrics are cheap at aggregate level but explode with cardinality (unbounded label combinations). Logs are rich but expensive per gigabyte. Traces are the most expensive per request unless you sample. Day 35 exists because all three show up on the same invoice.
The production glue is
trace_id(and consistentservicelabels). Without it, three dashboards tell three unrelated stories.POST /api/trafficin our lab appends spans and error logs with shared context—mirroring Day 29 instrumentation feeding Day 34 burn logic.
The Observability Feedback Loop
Traditional monitoring is reactive: alert fires, engineer opens five tabs. A mature loop is continuous and correlated:
Instrument services (OTel SDK → collector → backends)
Aggregate signals (Prometheus scrape, log index, trace store)
Visualize (Grafana dashboards provisioned from Git)
Define SLIs/SLOs (availability, latency, error rate over windows)
Burn error budget → page or freeze deploys (Week 4 GitOps + Week 5 SLO)
Optimize cost (sampling, retention, cardinality caps)
In ObserveStack, you simulate this loop locally:
Generate Traffic → increments Prometheus counters, appends spans/logs, recalculates SLO availability
Evaluate SLOs (Day 34) → reads error rate from traffic counters
Optimize Costs (Day 35) → lowers sampling and monthly cost metrics
Per-Day Metric Isolation (Platform Pattern)
Platform teams don’t mix “Grafana panels per hour” with “error budget %” on one wall during an incident—they separate concerns. We encode that in code:
STATE.metrics[29]  → OTel export rates only
STATE.metrics[34]  → error budget & burn only
A Run Demo (this day only) call runs apply_demo_day(N) and bumps only STATE.metrics[N]. The UI highlights changed cards in blue.
Architecture Deep Dive