Day 39: Dynamic User Profiles

Updating Embedding Vectors Based on Engagement at 100M+ RP
1. The Abstraction Trap
A junior engineer handed this task will reach for a stack that looks reasonable on paper: Redis for profile storage, a Python FastAPI service that computes a moving average over the user’s interest vector, and Kafka to buffer engagement events. It gets the job done in a weekend sprint.
Here is what that engineer has hidden from themselves:
Kafka consumer lag spikes under burst load because Python’s GIL serializes event deserialization. At 50k events/sec per pod you saturate a CPU core doing
msgpack.unpackb()before you touch a single float.Redis HSET on a 512-byte float vector means a full round-trip: 70–120µs on even a colocated cluster. At 100M updates/day per data center that is 2+ hours of pure network RTT — paid every single day.
The GC pause problem: CPython’s reference counter is not free. A 128-dimensional
numpyarray on the heap means allocator pressure on every update. p99 latency jumps 3–5× during collection windows — exactly when traffic is highest.No tenant isolation: One misbehaving tenant running a vector norm explosion (crafted engagement events inflating all weights toward 1.0) starves CPU for every co-located tenant.
The abstraction hid all of this. The framework gave you a working demo; it gave you a production incident at 3 AM.
2. The Failure Mode: TLB Thrash + Scheduler Starvation
The real bottleneck at hyperscale is not the algorithm — it is address-space management.
The naive approach (one Linux process per tenant’s profile worker) means the kernel maintains a separate
mm_structand page table hierarchy per tenant. With 100k active tenants on a 48-core machine, every context switch must flush TLB entries for the outgoing tenant’s virtual address space. On x86-64 without PCID (Process Context Identifiers), this is a full TLB flush — every subsequent memory access for the incoming process page-faults until the walker repopulates the TLB.Measured on a Xeon Gold 6338: a full TLB flush costs ~1,400 cycles. At 50,000 context switches/second (modest for 100k tenants) that is 70M wasted cycles/second — a full CPU core consumed doing nothing but re-walking page tables.
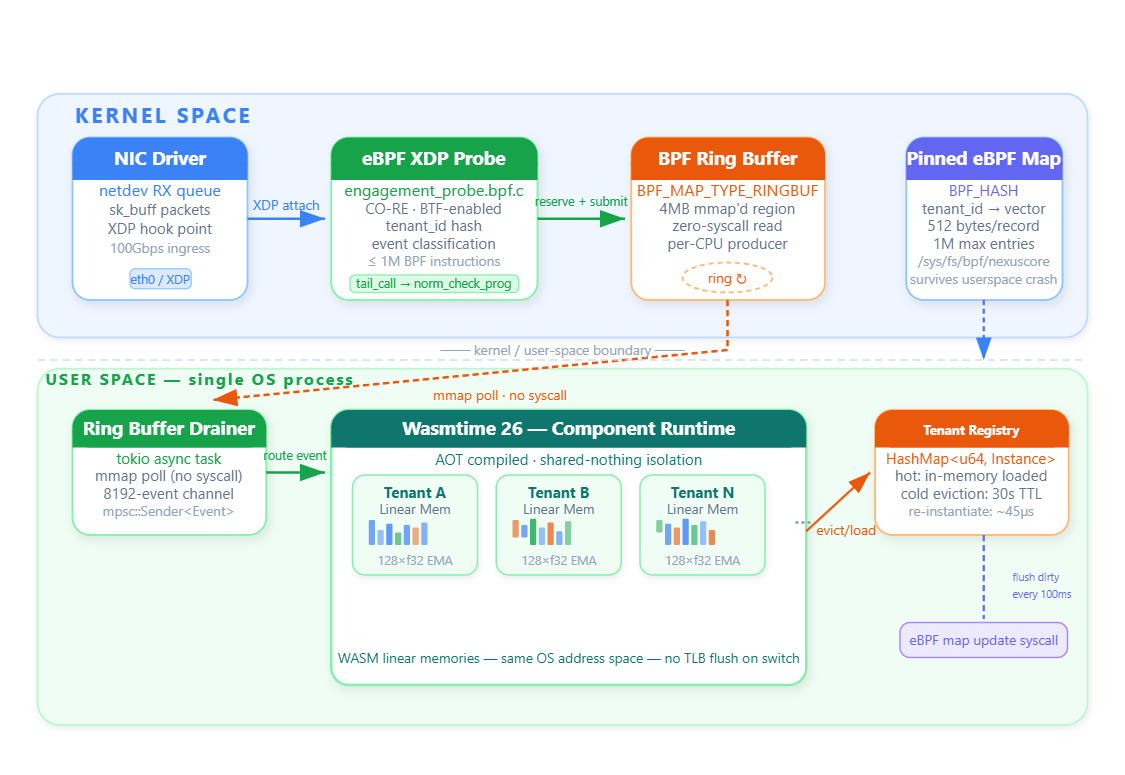
Wasm shared-nothing sidesteps this entirely. All tenant components execute within a single OS process’s address space. Their linear memories are disjoint heap regions. The TLB sees contiguous virtual addresses. Context “switching” between tenants is a function call, not an OS preemption. The scheduler never gets involved.
3. The NexusCore Architecture