
Day 35 — ReAct Agents: Building AI That Uses the Search Tool

The Abstraction Trap
A junior engineer building a ReAct agent in 2026 reaches for LangChain, CrewAI, or one of the twelve “agentic framework” wrappers that spawned after GPT-4’s function-calling API shipped. They write thirty lines of Python, call
.run("what's the weather?"), and ship it wrapped in a Docker container.Here’s what they don’t see:
Each agent loop iteration allocates a Python dict for the scratchpad, a string for the prompt, and a list for message history. That’s three separate heap allocations per thought step.
The HTTP call to the search API blocks the OS thread. The thread scheduler parks it, picks up another task, and pays a full context-switch cost (~1–5 µs on modern x86) on the way out and back.
At 10,000 concurrent agents—each doing 8–12 ReAct hops before answering—you have 80,000–120,000 blocking I/O events per second, each requiring scheduler intervention.
There is no kernel-level visibility. You know the wall-clock time of a
.run()call. You do not know whether 40% of that time is in TCP retransmit, waiting in the kernel’s TCP receive buffer, or in the LLM’s decode phase.The framework hid the syscalls. The syscalls are where your tail latency lives.
The Failure Mode: Scheduler Thrashing + TLB Pressure
Let’s be precise. The naive “thread-per-agent-loop” model breaks along two axes at scale:
Scheduler Thrashing Linux’s CFS scheduler has O(log N) wake-up complexity. At 10K threads, each blocking on
epoll_waitfor an HTTP response, the scheduler spends a measurable fraction of CPU time in__schedule()itself—not running your code. You can observe this withperf stat -e context-switches,cs. In benchmarks on a 32-core host, this overhead consumes ~8% of total CPU time at 8K concurrent blocking threads.TLB Pressure from Per-Step Heap Allocation Each “thought-action-observation” cycle in a Python/Node agent typically allocates 2–8 KB of short-lived heap data (prompt strings, JSON parse results). At high concurrency this triggers frequent minor GC cycles, which walk the heap and dirty TLB entries for pages that will be immediately freed. On x86-64, a full TLB flush (
INVLPG) costs ~20–100 ns. A GC that dirty-invalidates 512 entries per agent step, at 10K agents, is spending ~1–5 ms/sec in TLB management alone. This shows up as elevateddTLB-load-missesinperf stat.
The NexusCore Architecture: WASI 0.3 + eBPF CO-RE
The 2026 answer is to treat each ReAct step (not loop) as a WASI 0.3 component invocation.
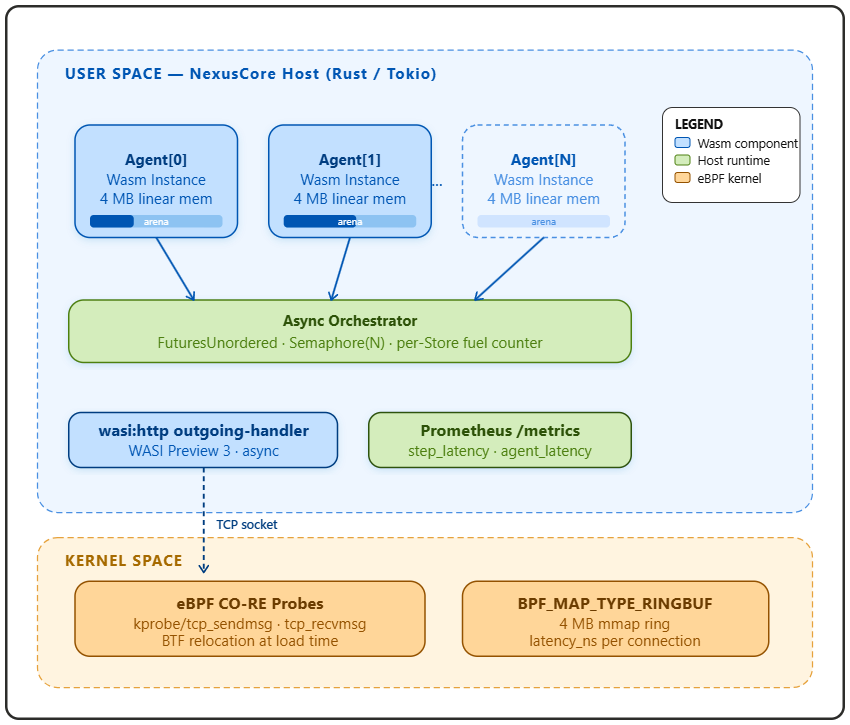
Key invariants:
Each Wasm instance gets its own 4 MB linear memory slab. There is no shared heap between agents. No GC. No lock contention on the allocator.
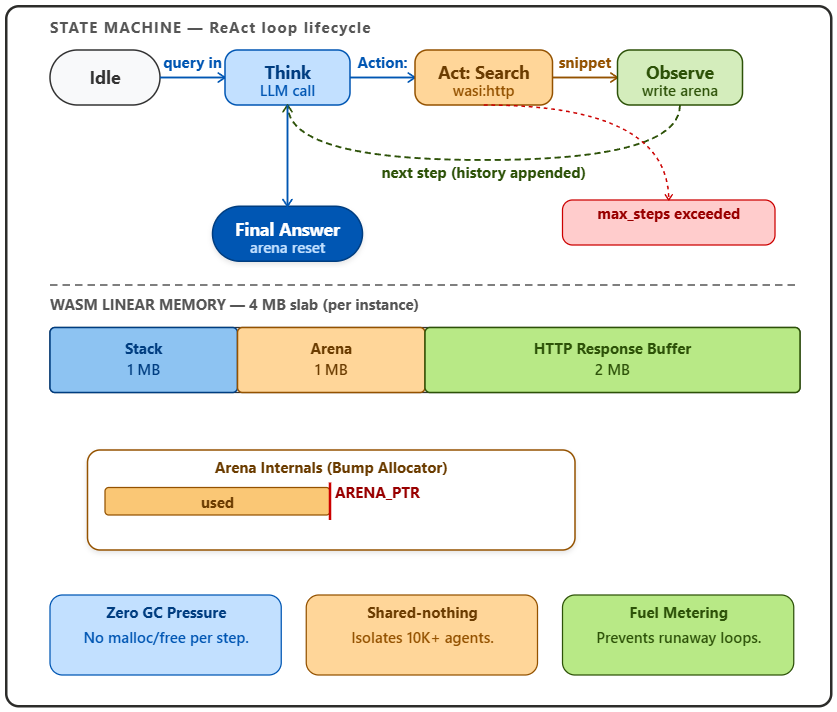
The scratchpad (thought + action + observation buffer) is a bump-allocated region inside Wasm linear memory at a fixed offset. Allocation is
ptr += len—zero syscalls, zero kernel involvement.The
wasi:http/outgoing-handlerinterface is async. The host’s Tokio runtime suspends the Wasm future at theawaitpoint, runs another agent’s step, and resumes this one when the TCP data arrives. No OS thread is parked.eBPF CO-RE probes attach to
tcp_sendmsgandtcp_recvmsgin the kernel. They record timestamps into aBPF_MAP_TYPE_RINGBUF. The userspace consumer correlates send/receive pairs by socket cookie to get per-search-call kernel-side latency.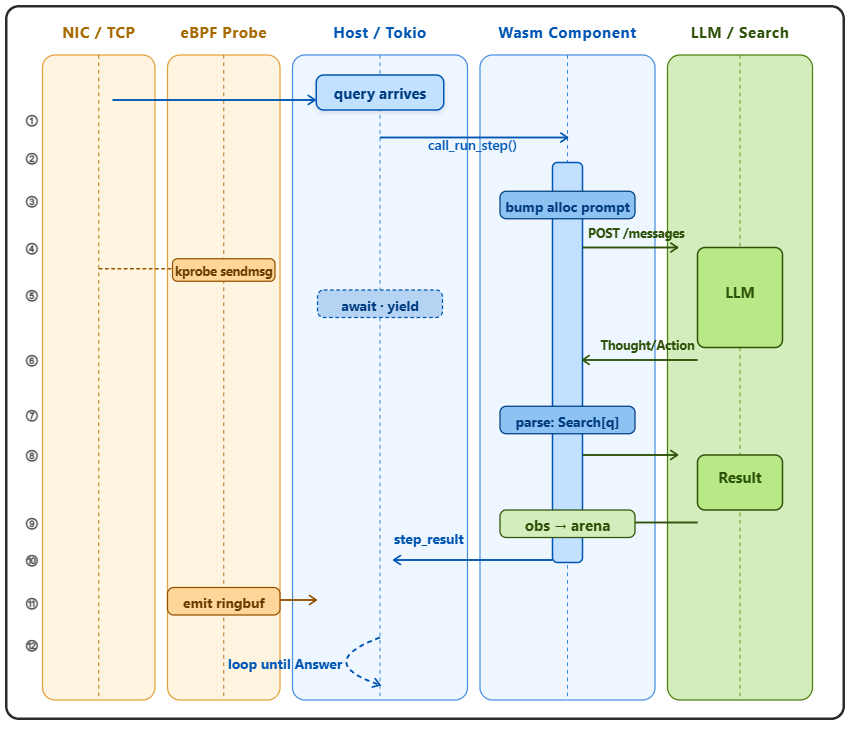
Implementation Deep Dive
GitHub Link:
https://github.com/sysdr/nexus-core-devops-engineering-p/tree/main/lesson35/nexuscore-day35
The Wasm Component: Bump Allocator + ReAct Loop
The WIT interface for our agent component (agent.wit):
package nexuscore:agent@0.1.0;

interface react-agent {
  record step-result {
    thought: string,
    action: option<string>,
    observation: option<string>,
    final-answer: option<string>,
  }

  run-step: func(
    query: string,
    history: list<step-result>,
    search-endpoint: string,
  ) -> result<step-result, string>;
}

world agent-world {
  import wasi:http/outgoing-handler@0.3.0;
  import wasi:io/streams@0.3.0;
  export react-agent;
}
The Rust implementation uses a fixed-size arena allocated once at component init. The 4 MB linear memory page is split:
Offset 0x000000 - 0x0FFFFF : Stack (1 MB, grows down from 0x100000)
Offset 0x100000 - 0x1FFFFF : Scratchpad arena (1 MB, bump alloc)
Offset 0x200000 - 0x3FFFFF : HTTP response buffer (2 MB)
The run-step export function is called by the host orchestrator on each iteration. It:
Serializes the
historyinto the scratchpad arena (bump alloc—nomalloc).Builds a prompt string in the arena, sends it to the LLM endpoint via
wasi:http.Parses the LLM response (looking for
Thought:,Action:,Final Answer:prefixes).If
Action: Search[query]is found, issues a secondwasi:httpcall to the search endpoint.Returns the populated
step-result; the host re-invokes with updated history.
The bump allocator resets between run-step calls (the host calls a reset-arena export). This means zero fragmentation regardless of loop depth.
The eBPF CO-RE Probe
The C probe attaches to tcp_sendmsg and records a {socket_cookie, send_ts_ns} entry in a BPF_MAP_TYPE_HASH. On tcp_recvmsg, it looks up the cookie, computes recv_ts - send_ts, and pushes the delta into a BPF_MAP_TYPE_RINGBUF. The userspace consumer in Rust reads from the ring buffer via mmap and maintains a per-agent latency histogram.
Key CO-RE pattern used:
// BTF-based field access — no kernel header dependency
__u64 cookie = BPF_CORE_READ(sk, __sk_common.skc_cookie.counter);
This compiles once and runs on any kernel ≥ 5.15 without recompilation.
The Host Orchestrator
The Rust host uses wasmtime::component::Component with an async Store. Each agent is a separate Store (separate linear memory, separate fuel counter). The orchestrator runs a FuturesUnordered pool capped at N concurrent agents. When a Wasm future awaits on wasi:http, Tokio’s I/O driver handles the socket—zero OS threads blocked.
Working Demo Link :
Production Readiness: Metrics to Watch
Metric Tool Danger Threshold wasm_step_latency_p99 Prometheus histogram from host > 500 ms search_kernel_latency_p99 eBPF ring buffer > 50 ms wasm_cold_start_us WASMTIME_COMPILE_CACHE hit rate > 200 µs arena_reset_count Wasm export counter If missing resets → OOM context_switches/sec perf stat -e cs > 500K/sec on 32-core dTLB-load-misses perf stat > 2% of total loads bpf_ringbuf_drop_count /sys/kernel/debug/tracing/... Any drops = probe overload
Cold start budget: component instantiation + AOT cache hit should be < 150 µs. Use wasmtime_cache_config with an on-disk AOT compilation cache. First instantiation compiles; subsequent ones load the cached native code.
Setup
Tools required:
Rust 1.80+ with
wasm32-wasip2targetwit-bindgen-cli0.28+wasmtimeCLI 22+cargo-component0.14+Linux kernel ≥ 5.15 with BTF enabled (
CONFIG_DEBUG_INFO_BTF=y)clang17+ for eBPF CO-RE compilationbpftoolfor skeleton generation
Verification commands:
# Confirm WASI P2 target available
rustup target list --installed | grep wasm32-wasip2

# Confirm BTF is available on your kernel
ls /sys/kernel/btf/vmlinux

# Build and verify the Wasm component
cargo component build --release
wasmtime component wit target/wasm32-wasip2/release/nexuscore_agent.wasm

# Run eBPF probe (requires root)
sudo ./target/release/ebpf_loader &
# Check ring buffer output
sudo cat /sys/kernel/debug/tracing/trace_pipe | grep nexuscore

# Smoke test: single ReAct query
./scripts/demo.sh "What is the current Rust edition?"

# Load test: 200 concurrent agents
./scripts/loadtest.sh 200
Homework: Production-Level Challenge
Extend the eBPF probe to measure per-step LLM decode latency (not just TCP round-trip). To do this:
The Wasm component must write a
step_id(u64) into a shared memory region readable by the host.The host writes
{step_id, send_ts}into aBPF_MAP_TYPE_HASHvia a pinned map at/sys/fs/bpf/nexuscore/step_timings.A second eBPF program attached to
tcp_data_readyreads the pinned map, correlates by socket cookie → step_id, and emits a{step_id, decode_latency_ns}event.Build a percentile histogram in userspace and expose it on a Prometheus
/metricsendpoint.
You now have full-stack latency attribution: kernel TCP time vs LLM decode time vs Wasm execution time—without a single userspace timer call in the hot path.