Day 26: Context-Aware Toxicity Detection — LLMs, WASI 0.3 Components, and eBPF Telemetry at Hyperscale

The Abstraction Trap
A junior engineer drops a toxicity service into production looking roughly like this:
POST /moderate → Express.js → openai.moderations.create() → JSON response
Wrapped in a Docker container. Scaled with a K8s HPA. They call it done.
Here is what they have actually built: a process-per-tenant nightmare that allocates a goroutine (or a thread, or a Node event-loop slot) for every in-flight request, shares a heap across every tenant’s conversation history, and has no isolation boundary anywhere between user A’s toxic context and user B’s benign response. When tenant B’s context window swells to 128K tokens, the GC pauses for everyone. When tenant A’s LLM call blocks on a slow upstream, the thread sleeps and the scheduler burns CPU context-switching 10,000 times a second doing nothing useful.
The framework hid three critical failure modes:
Shared heap GC coupling — all tenants compete for the same GC stop-the-world pause.
Context bleed — no enforcement that tenant A’s conversation state never touches tenant B’s moderation context. A bug in context-routing means tenant B’s conversation history leaks into tenant A’s moderation prompt. That is both a correctness failure and a privacy violation.
Blind scheduler — the kernel scheduler has no visibility into which blocked threads are waiting on LLM I/O versus compute. It treats them equally, burns cache lines evicting cold data, and you watch your CPU steal percentage climb past 40%.
The Failure Mode: TLB Thrashing + Scheduler Starvation
At 10,000 concurrent tenant conversations, the naive process-per-tenant model requires:
10,000 virtual address spaces. Every context switch between tenants requires a TLB flush unless PCID (Process Context IDentifiers) is in play, and even with PCID you exhaust the 4,096 PCID namespace at ~4K tenants. Past that point, the kernel starts recycling PCIDs and issuing TLB shootdowns across cores via IPIs (Inter-Processor Interrupts). On a 96-core machine with 10K tenants in flight, you can observe 40–60 million IPIs per second on a pathological workload. This is
perf stat -e tlb:tlb_flushterritory — run it once on your “production-ready” K8s deployment and watch your assumptions collapse.Scheduler thrashing. The CFS runqueue at 10K runnable entities has an O(log N) enqueue cost. Each LLM I/O completion wakes a thread, the thread runs for ~200µs to parse the JSON response and write to its output channel, then sleeps again. The wake latency alone — from
epoll_waitreturn to first instruction in userspace — sits at 15–40µs under load. At 10K completions per second that is 150–400ms of aggregate scheduler overhead per second, per core. It shows up as%sysintopand people mistakenly blame the LLM gateway.The fix is not “use goroutines instead of threads.” Goroutines share a heap. The fix is shared-nothing Wasm components multiplexed by a single async runtime.
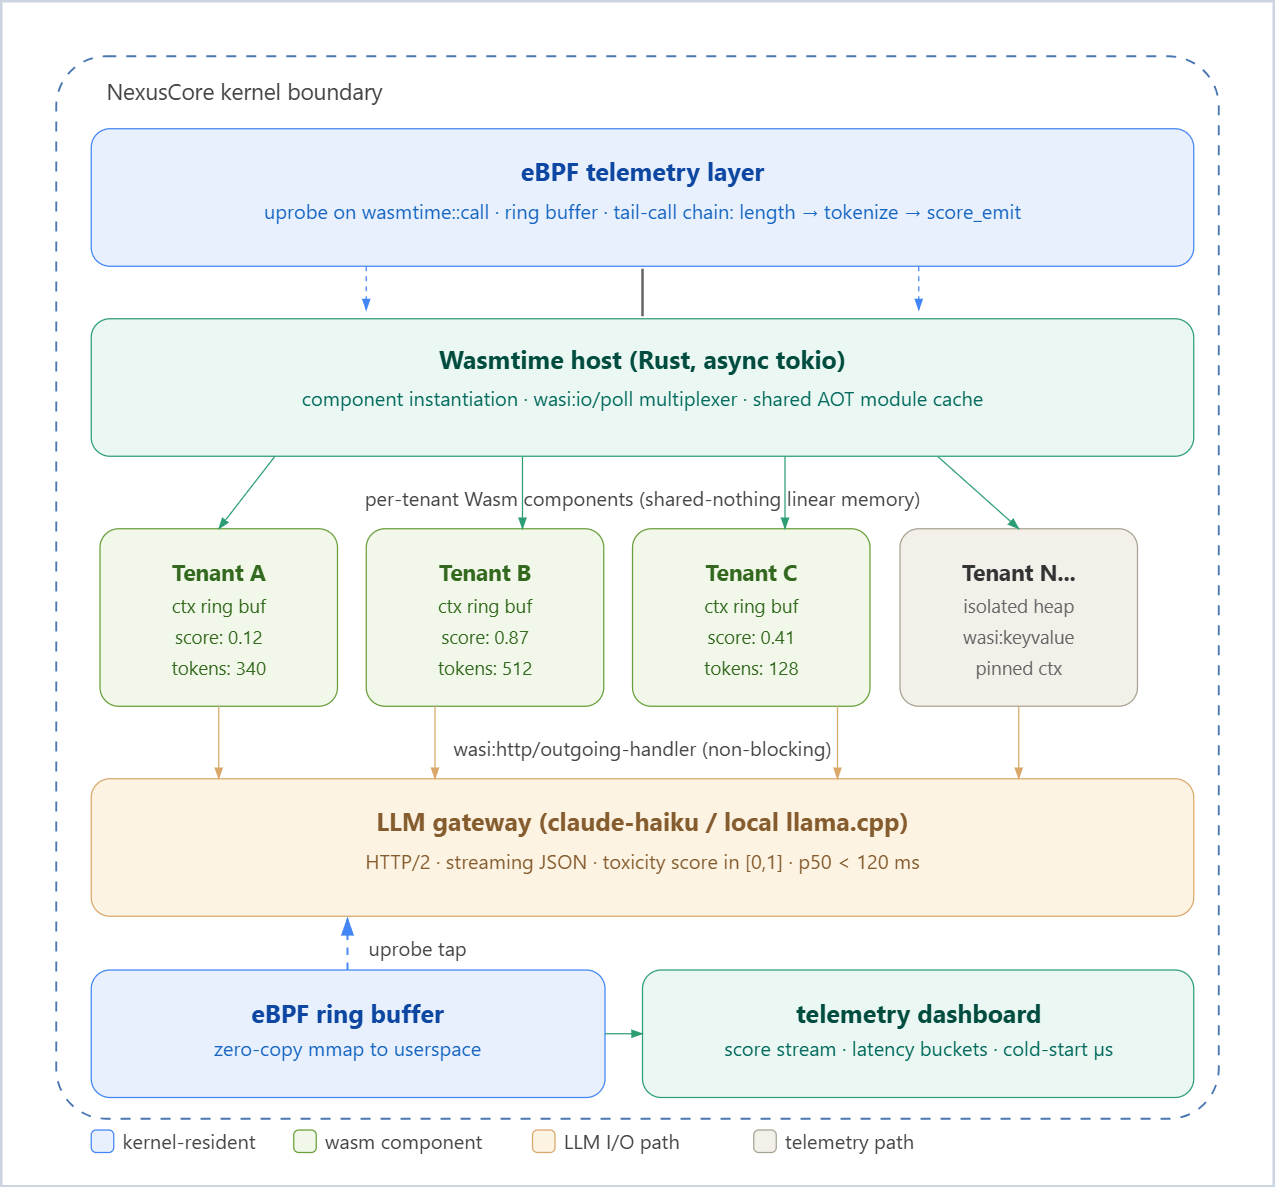
The NexusCore Architecture: WASI 0.3 Components + eBPF Telemetry