Day 13: Vector Search — Installing and Tuning Qdrant at Hyperscale

The Abstraction Trap
A junior engineer handed a “vector search sprint” opens the Qdrant docs, runs
docker pull qdrant/qdrant, wraps it in a K8s Deployment with three replicas, and calls it done. The CI pipeline is green. Load tests at 100 RPS look fine.Then you hit 50,000 tenants, each making burst queries against their own collection. The scheduler starts thrashing. RSS climbs past the node’s physical RAM. p99 latency crosses 2 seconds. The on-call engineer stares at Datadog, sees CPU at 40%, and concludes “we need bigger nodes.” They are wrong.
The problem is architectural, not capacity. And it starts with not understanding what Qdrant is actually doing inside the kernel.
The Failure Mode: TLB Churn and WAL Contention
When you deploy one Qdrant instance per tenant (the “clean isolation” approach), you are creating one process per tenant. Each process maintains its own HNSW graph in memory. At 50K tenants with a 128-dimensional float32 corpus of 1M vectors per tenant, you are asking the kernel to track 50K independent virtual address spaces, each with multi-gigabyte mmap regions for the HNSW graph.
The TLB (Translation Lookaside Buffer) on a modern x86-64 CPU holds around 1,536 entries for 4 KiB pages. Each context switch to a different process flushes the TLB (or requires PCID tags, which you’ve likely not configured). A node handling 50K tenants with short-burst query patterns will see TLB miss rates exceeding 40%, measured by
perf stat -e dTLB-load-misses. Every TLB miss is a page-table walk: 4 memory accesses across 4 levels of the page hierarchy. For HNSW traversal, which is pointer-chasing through a graph of ~M/ef_construction average candidates per layer, TLB misses compound directly into search latency.The second failure is WAL contention. Qdrant’s shared WAL uses a ring-buffer model per collection. When hundreds of collections share one Qdrant process under write pressure, WAL segment sealing — the operation that transforms mutable WAL entries into immutable indexed segments — competes for the same kernel I/O scheduler queue.
iostat -x 1will showawaitclimbing, not because your disk is slow, but becauseio_depthis saturated with simultaneous fsync calls from tens of collections sealing simultaneously.
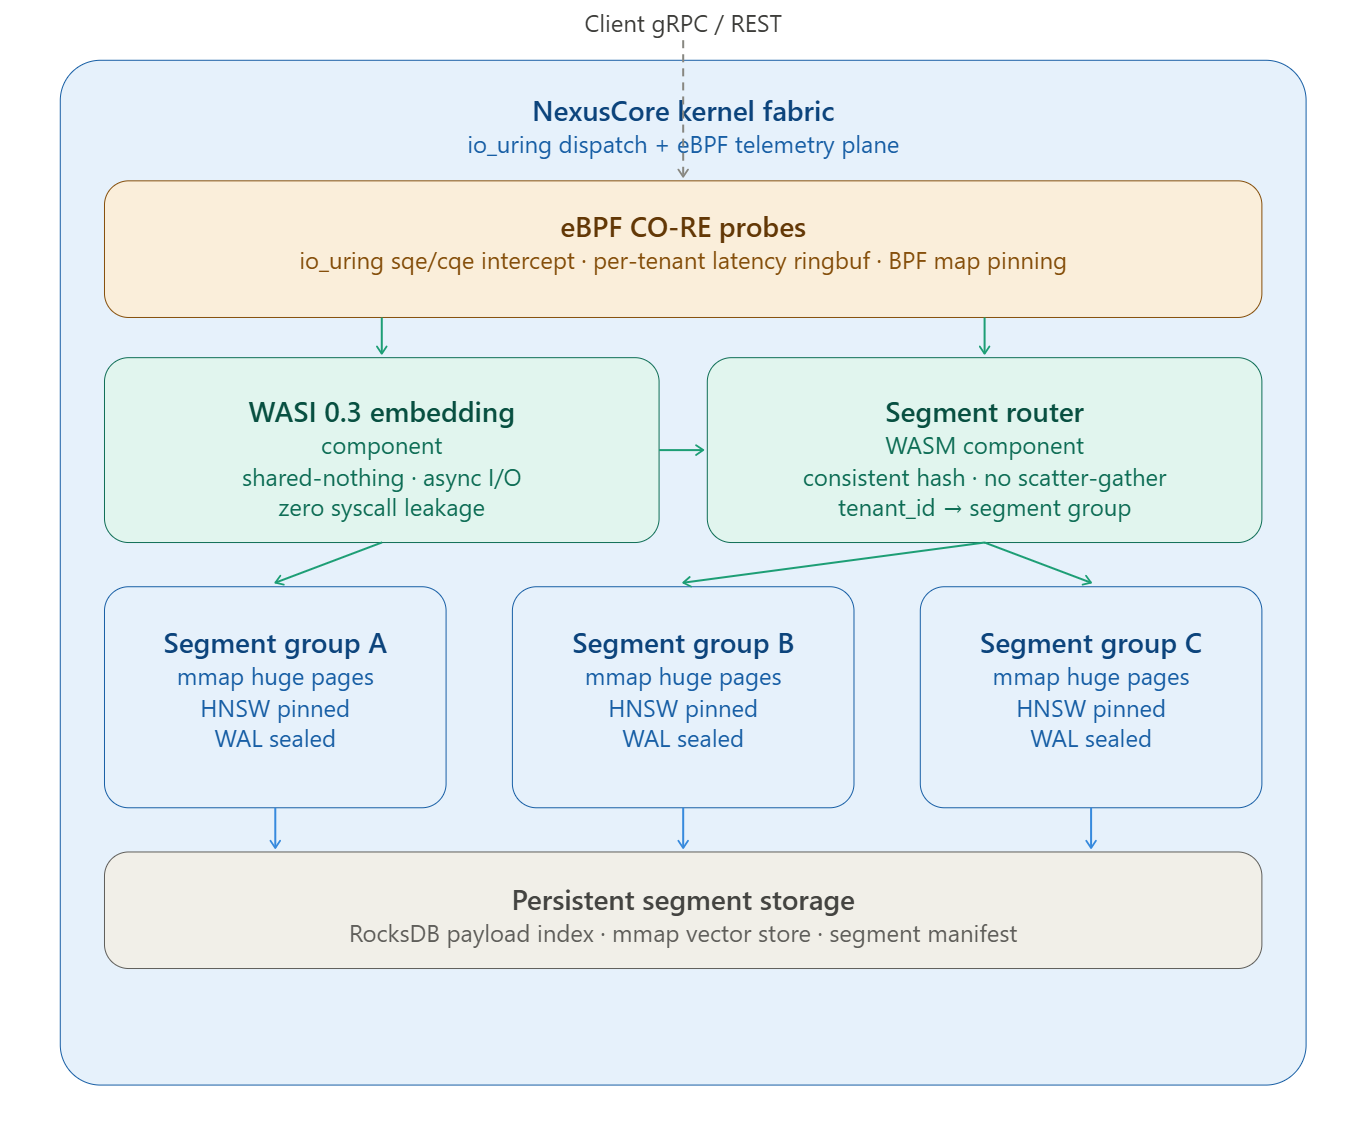
The NexusCore Architecture